UCSD Musculoskeletal Radiology
bonepit.com
DEXA reporting guide
|
|
UCSD Musculoskeletal Radiology bonepit.com DEXA reporting guide |
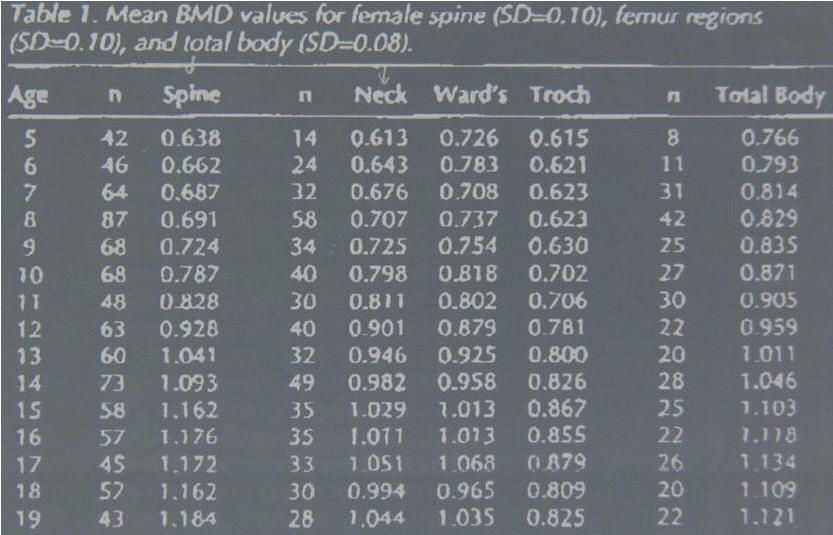
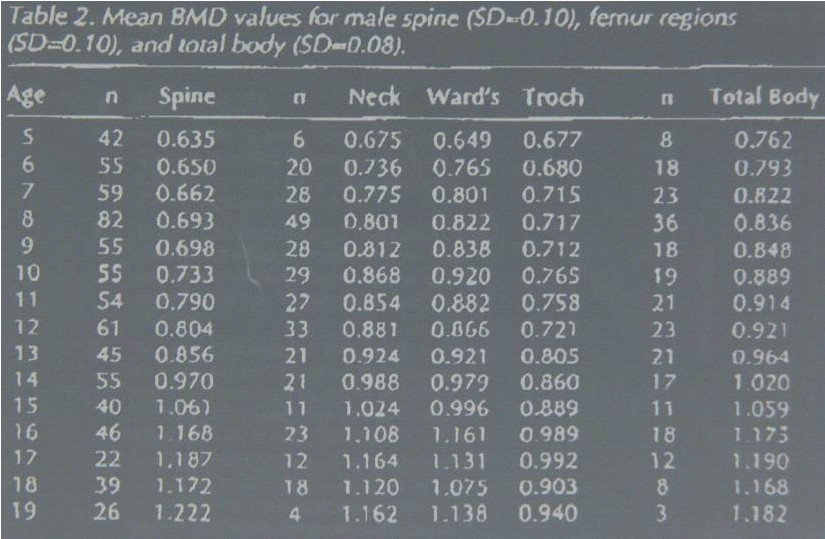
Use tables below to extrapolate back from age 19 (young adult) to age of patient, multiple obtained fraction by reference number above for sex of patient.


How to tackle bone density (DEXA) reporting.
Percentage of young normal mean is ________%.
T-Score is __________.
Percentage age-matched mean is _________%
Z-Score is __________.
5. WHO classifiacation T score (young adult variation in negative SD's) is
> -1SD = Normal
-1 and > -2.4999 inclusive SD = Osteopaenia
=/< -2.5SD = Osteoporosis
=/< -2.5SD + fracture at wrist, humeral neck, femoral neck, spine or insuffiency fracture (sacrum) = Established or Manifest Osteoporosis.
Dictate WHO classification.
6. Spine: Check the picture for levels. Look for lowest rib. Bottom of L4 is close to iliac crests. Look for any one level that stands out from the crowd (? met)
Look at the ancillary results to see if there is any loss of vertebral height. Usually a slight increase for each vertebrae on descending.
Thornton we quote L2-4. 4th and Lewis we quote L1-4. Most important of all quote the previously used levels if a folowup.
Dictate levels used and fill in the blanks.
The bone mineral density is _________gm/cm aq.
Percentage of young normal mean is ___________%.
T-Score is __________%.
Percentage of age-matched mean is _________%.
Z-Score is ________.
State the WHO classification as per the femoral neck.
Dictate an impression. State any unusual findings. If discrepency between neck and spine,try to see why, and dictate. Spine may be degenerative (increased density of lower levels), hip may have OA and increassed friction increases femoral neck density. Need to always dictate L1-4 or L2-4, but if one level is bad or upper is worse than lower dictate extra set of findings and WHO, since if low this will affect fracture risk.
For follow up study need to compare like with like. Calculate percentage change in BMD between studies for both neck and spine and dictate. Try to explain any significant change. Response to treatment, further degeneration, menopausal etc. Normal rate of bone loss is 2% per annum increasing to 4% during menopause and back to 2% post menopause (see patient data sheet). Study is 1% accurate. If you would have expected the bone density to have fallen 4% in 2 years, and it is static, then this is a positive response to RX. Compare vertebral heights. Look for any significant weight change (see below).
Notes:
Any problems, bring the study to conference or show Tudor.
For pediatric patients there are refernce ranges in my office at Thornton, and on the bone board.
The T score is based on a white, same sex, age
20-40 population. The patient's BMD is compared to this population's BMD. A
lower T score means that the patient BMD is low compared to this young, healthy
normal weight population.
The Z score compares the patient to an adjusted population, it adjusts for age,
weight, and ethnic background. The Z score can be lower than the T, if the
average patient in this population, is higher than the average in the T score
population. This can be seen in patients with higher weights, (which increases
bone density), and in African American groups, (which show increased bone
density).
If the patients comparison group has a generally higher bone density, then it is possible to have a poorer comparison (lower T score) to others of same age, than to younger comparisons in generally lower density group.
Weight gain (loss) should cause an increase (decrease) in absolute BMD. Weight gain (loss) will affect T score comparison, since reference range will not have changed. Hence an increase in weight with a corresponding increase in bone density, will look like a good improvement in T score, but fracture risk is unchanged.
David Sartorisís previous studies that do not mention the region or levels measured, were standardized for L1-4 and the femoral neck. He usually did not quote BMD. Many previous studies were prior to the current database. Use the percent young adult as a guide to percentage change.
TEMPLATE
CLINICAL HISTORY:
REFERENCE FILMS:
FINDINGS:
FEMUR:
The bone mineral density is _________ gm/cm aq.
Percentage of young normal mean is ________%.
T-Score is __________.
Percentage age-matched mean is _________%
Z-Score is __________.
World Health Organization and National Osteoperosis Foundation Classification is
COMMENTS:
LUMBAR SPINE:
The bone mineral density is _________gm/cm aq.
Percentage of young normal mean is ___________%.
T-Score is __________%.
Percentage of age-matched mean is _________%.
Z-Score is ________.
World Health Organization and National Osteoperosis Foundation Classification is
COMMENTS:
IMPRESSION:
CLINICAL INFORMATION SHEET

Bone Density Clinical Information Sheet
Circle Correct Responses
Name(Label) Sex: M or F
(Premenopausal)
F (Perimenopausal)
(Postmenopausal)
On Hormone Replacement Therapy? N Y
On other treatment for osteoporosis? N Y See over
Previous Surgery: Spine? N Y right
Hips? N Y which?
Uterus/Ovaries? N Y left
Known Osteoarthritis? N Y
Previous Scans When? Where?
Risk Factors
Previous Fractures N Y Where?
Family History Osteoporosis N Y
Medication Steroids N Y
For Epilepsy N Y Which drug?
For Thyroid N Y Which drug?
Dietary Calcium High Low
Cigarette Smoking N Y
Known Bowel Disease(diarrhoea) N Y Diagnosis?
Other Medical Condition N Y List
Radiographer:
Comment:
Bone densitometry drug sheet
Drugs that may cause osteoporosis
|
Corticosteroids |
|
|
Dilantin |
|
|
Diuretics |
|
|
Methotrexate |
|
|
Thyroxine |
|
|
Heparin |
|
|
Depomedroxyprogesterone acetate |
|
|
Gonadotrophin releasing hormone agonists |
|
|
Cyclosporin |
Drugs to treat osteoporosis
|
HRT: Estrogen |
|
|
(SERMS): Raloxifene (Evista) |
|
|
Calcitonin: (Nasal spray) (Miacalcin) |
|
|
Bisphosphonates: Alendronate (Fosamax) |
|
|
Etidronate (Didronel) |
|
|
Risedronate (Actonel) |
|
|
Ibandronate |
|
|
Pamidronate (Aredia) |
|
|
Others: Combinations, Thiazides, Fluoride, PTH, Growth Hormone, Bicarbonate, Active Vitamin D |
I. Girls
| Tanner Stage | Stage of develop | Pubic Hair | Breasts |
| Stage 1 |
Early adolescence (10-13 years) |
Preadolescent | Preadolescent |
| Stage 2 | Sparse, straight | small mound | |
| Stage 3 |
Middle adolescence (12-14 years) |
Dark, curl | bigger; no contour separation |
| Stage 4 | Coarse, curly, abundant | Secondary mound of areola | |
| Stage 5 |
Late Adolescence (14-17 years) |
Triangle; medial thigh | nipple projects; areola part of breast |
I. Boys
| Tanner Stage | Stage of develop. | Pubic Hair | Penis | Testes |
| Stage 1 |
Early adolescence (10.5-14 years) |
None | Preadolescent | preadolescent |
| Stage 2 | Scanty | Slight increase | larger | |
| Stage 3 |
Middle adolescence (12.5-15 years) |
Darker, curls | Longer | larger |
| Stage 4 | adult, coarse, curly | Larger | scrotum dark | |
| Stage 5 |
Late adolescence (14-16 years) |
adult - thighs | Adult | adult |
Middle Adolescence (Stages 3 and 4): acceleration of weight and growth as well as above secondary sex characteristics. Pubic hair first, then axillary, then facial hair.